

If you are searching for ABA behavior data sheets, start with one important distinction: a data sheet is a recording tool, not a treatment plan. The right sheet is the one whose fields match the written operational definition, measurement system, timing rule, opportunities, and supervision instructions. A beautiful template with the wrong unit can produce a neat-looking number that answers the wrong question.
Table of Contents
- What ABA behavior data sheets actually do
- ABA behavior data sheets: the fields to check before a session
- Match the data sheet to the measurement system
- Event, frequency, and rate sheets
- Duration, latency, and interval sheets
- Where ABC and context records fit
- Paper or digital: the format is secondary to fidelity
- How to audit data quality before trusting the number
- From a data sheet to a graph
- The RBT role: use the sheet, protect the record, ask for direction
- ABA behavior data sheets: a quick study and session checklist
- Frequently Asked Questions
- References
For an RBT, the goal is not to invent a new form for every session. It is to collect the information specified by the program, enter it accurately, identify missing or unreliable data, and communicate relevant concerns to the supervisor. Paper and digital formats can both work when the recording rules are clear and the record is protected.
The current RBT Test Content Outline (3rd ed.) includes 43 tasks across six domains. Domain A, Data Collection and Graphing, covers eight tasks: continuous measurement, discontinuous measurement, permanent product, data entry and graphs, observable and measurable descriptions, calculations and summaries, graph trends, and risks of unreliable data or poor procedural fidelity. The current exam includes 75 scored questions and 10 unscored questions. RBT Training’s examples here are independent, newly written study content—not official, recalled, leaked, or BACB-endorsed questions.
This guide explains how to understand, choose, and audit a behavior data sheet. It does not authorize an RBT to change a client’s program, measurement system, or clinical decision without supervision. No template, article, or practice score can guarantee certification or a passing result.
What ABA behavior data sheets actually do
An ABA behavior data sheet turns an observation into a structured record. It can provide places for the target name, operational definition, observation window, measurement unit, raw values, prompts, opportunities, contextual notes, and session summary. The form is useful only if those fields support the procedure that the supervising team selected.
| Sheet feature | Question it should answer | Risk if it is missing |
|---|---|---|
| Operational definition | What counts, and what does not count? | Different observers may record different events. |
| Measurement unit | Am I counting, timing, sampling, or scoring a product? | The value may look precise while measuring the wrong dimension. |
| Observation window | When did observation start and stop? | Counts from unequal exposure periods may be compared unfairly. |
| Opportunity or trial field | How many chances were available? | A raw correct count may hide that opportunities changed. |
| Prompt or independence field | Was the response independent or supported? | Completed work may be mistaken for independent skill. |
| Missing-data note | What happened when the device, observer, or procedure failed? | Someone may fill a gap with an invented estimate. |
The data sheet does not decide which field is clinically necessary. The plan and supervisor do. The RBT should be able to locate the relevant fields and ask for clarification when the form does not match the written procedure.
ABA behavior data sheets: the fields to check before a session
Before using any ABA behavior data sheets, run a short field audit. The exact layout can vary, but a practical sheet usually makes these elements visible:
- Client or program identifier: use the approved identifier and protect confidential information.
- Date, setting, observer, and session time: record the context needed to interpret the value.
- Target and definition: copy the current program language rather than replacing it with a personal shorthand.
- Measurement system and unit: identify frequency, rate, duration, latency, interval, permanent product, trial percentage, or another specified measure.
- Timing rule: state the start and stop events, interval length, signal, or observation window.
- Opportunity count: include trials, instructions, or available opportunities when the plan requires them.
- Prompt and response information: record the prompt level, independence, error, or correction rule when specified.
- Summary and exception notes: distinguish direct observation from a contextual note, device failure, or missing value.
Original example: a sheet that says only “task completion: 7” is difficult to interpret. A stronger record might show 7 independent completed responses out of 10 opportunities, the prompt rule, the defined work period, and a note that two opportunities were interrupted by a fire-drill announcement. The extra fields do not make the number automatically valid, but they make the number more auditable.
Match the data sheet to the measurement system
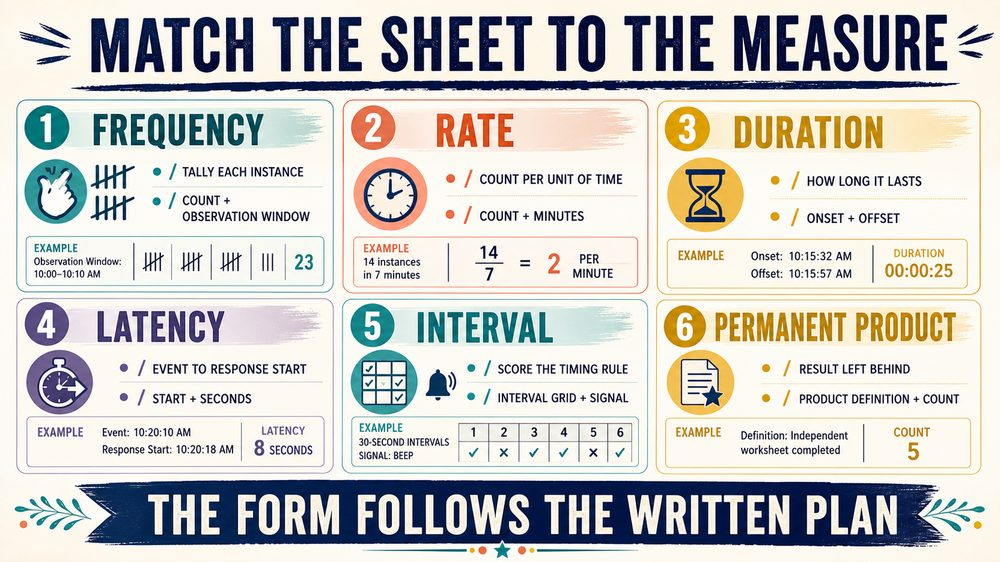
Different measurement systems need different layouts. The word “data sheet” does not identify the method by itself. Read the plan first, then choose or use the form that can capture the named unit without forcing a different procedure.
| Measurement system | Useful sheet fields | Original RBT example |
|---|---|---|
| Frequency or event recording | Tally or count, observation start and stop, target definition | Count each defined instance of hand hitting during a 30-minute observation. |
| Rate | Total count, exact observation time, rate calculation | Record 8 requests in 20 minutes and calculate the plan’s specified rate. |
| Duration | Onset, offset, episode total, observation window | Record the start and end of each defined crying episode. |
| Latency | Instruction or event time, response onset, elapsed seconds | Measure time from the instruction to the start of the requested response. |
| Discontinuous measurement | Interval grid, interval length, scoring rule, signal or check moment | Score partial interval only when the target occurs at any point in the block. |
| Permanent product | Product definition, count or accuracy rule, completion boundary | Count worksheet items completed under the written definition. |
| Trial or opportunity recording | Opportunity number, response, prompt level, correction or independence | Record independent, prompted, incorrect, or no response for each trial. |
Frequency and rate are not the same. A count of 8 has a different meaning when it occurred in 5 minutes versus 40 minutes. Duration and latency both use time, but duration measures how long a response lasts while latency measures time from an event to response onset. A sheet should make those differences visible.
Event, frequency, and rate sheets
For event recording, the observer records each occurrence that meets the definition. A simple tally can work for a clearly observable, low-to-moderate rate behavior, but the sheet still needs the target, observation window, and count rule. If the plan calls for rate, the time denominator must remain accurate.
Original scenario: the plan defines an independent request as a spoken or aided request made within 10 seconds of an item being available. The learner makes 6 independent requests during a 15-minute opportunity period and 3 prompted requests. The sheet should not collapse those into “9 requests” if the program distinguishes independence. If the plan asks for independent rate, use the independent count and the stated time window.
Do not convert a count into a rate using an estimated session length. If a transition interrupted the timer, document the actual observation period and follow the supervisor’s procedure for incomplete sessions.
Duration, latency, and interval sheets
Duration sheets need a reliable onset and offset rule. Latency sheets need a clearly defined antecedent or instruction and a response-onset rule. Interval sheets need the interval length, the scoring rule, and a signal or timing method. These details prevent “time” from becoming a vague catch-all.
- Duration: record how long the defined behavior lasts, not how serious it felt.
- Latency: record elapsed time from the named event to the start of the defined response.
- Partial interval: score yes if the behavior occurs at any point in the interval.
- Whole interval: score yes only if the behavior occurs for the entire interval.
- Momentary time sampling: check whether the behavior is occurring at the specified moment.
Original example: if a learner looks away for two seconds during a 10-second interval, partial interval may be yes, whole interval is no, and momentary time sampling depends on whether the learner is looking away at the check moment. The same sheet should not contain a generic “present?” box without making the scoring rule clear.
Where ABC and context records fit
ABC recording organizes information about an antecedent, the observable behavior, and a consequence or immediate event that followed. It can help the supervising team describe patterns, but an ABC note is not automatically a functional analysis and does not by itself prove the function of behavior.
| Record | Write | Avoid |
|---|---|---|
| Antecedent | Observable events immediately before the behavior, such as an instruction, transition, or item removal. | Unverified intentions such as “the learner wanted attention.” |
| Behavior | What was seen or heard using the operational definition. | Labels such as “was defiant” without a measurable description. |
| Consequence | What happened immediately after, including observable staff or environment changes. | A claim that the consequence caused or maintained the behavior without analysis. |
Use only the ABC fields and purpose specified by the plan. If the form asks for a contextual note, separate observation from interpretation. “Teacher presented a math worksheet; learner pushed two pages to the floor; teacher removed the worksheet for 30 seconds” is more auditable than “math demand caused escape behavior.”
Paper or digital: the format is secondary to fidelity
Paper and digital sheets each have practical advantages. Paper can remain available during a device or network failure; digital systems can calculate, time-stamp, and graph when configured correctly. Neither format is automatically more accurate.
| Format question | What to verify |
|---|---|
| Can the observer record in real time? | The form should not require long navigation or memory-based reconstruction. |
| Can the system preserve raw values? | Edits, corrections, and missing values should follow workplace procedure. |
| Does it use the correct units? | Check seconds versus minutes, count versus rate, and percent versus raw trials. |
| Can it handle interruptions? | There should be a documented way to mark a pause, device failure, or incomplete observation. |
| Is confidential information protected? | Use approved storage, access, and disclosure procedures. |
A digital app can automate a calculation, but it cannot decide whether the operational definition was applied correctly. A paper form can preserve a timestamped note, but it cannot make an unclear plan clear. Fidelity comes from matching the tool to the procedure and using it consistently.
How to audit data quality before trusting the number
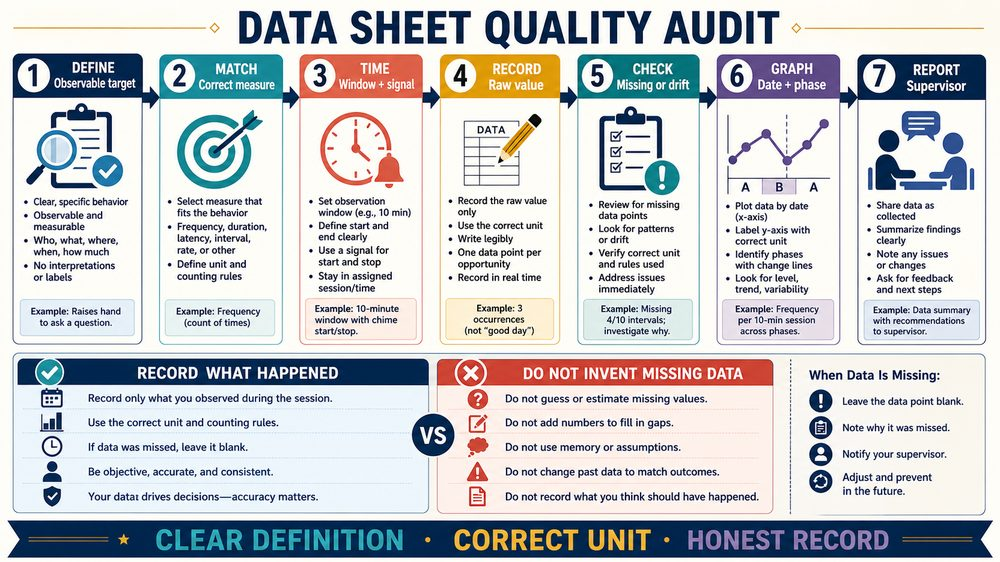
Accurate-looking data can still be unreliable. Before interpreting a value, check the chain from definition to graph:
- Definition check: did the recorded event meet the current definition?
- Unit check: was the correct measure used—count, time, interval, trial, or product?
- Timing check: were start, stop, intervals, signals, and opportunities applied as written?
- Entry check: did the value go to the right client, target, date, phase, and graph?
- Missing-data check: are gaps or device failures labeled rather than silently estimated?
- Fidelity check: were prompts, reinforcement, correction, and other procedure steps implemented as written?
- Communication check: did the RBT report an uncertainty or irregularity to the supervisor?
For example: a graph drops sharply after a new digital form is introduced. Before concluding that behavior changed, the team should ask whether the form changed the interval length, omitted prompted responses, or made it harder to record during transitions. The graph may reflect a measurement change rather than a client change.
From a data sheet to a graph
Entering data and updating graphs are current Domain A tasks, but the graph is only as trustworthy as the source record. Check the date, phase, unit, target, and calculation before entering a value. A correct number placed on the wrong graph can produce a false trend.
When describing a graph, distinguish observation from conclusion. “The recorded rate decreased across the last four sessions” is an observable summary. “The intervention solved the problem” is a clinical conclusion that requires the supervising team’s broader analysis. A single high or low point is not automatically a trend; consider level, direction, variability, phase, opportunities, and relevant context.
Do not smooth, delete, or replace an inconvenient value to make the graph easier to read. If an entry is corrected, follow the approved correction procedure and preserve the reason for the change.
The RBT role: use the sheet, protect the record, ask for direction
RBTs collect and enter data under ongoing supervision according to written programs and workplace requirements. The RBT does not independently select a new measurement system, rewrite the operational definition, change a prompt hierarchy, alter reinforcement criteria, or declare that a graph authorizes a treatment change.
- Before the session: review the target, definition, measurement unit, timing, opportunity rule, and approved tool.
- During the session: record what the plan defines and use the stated prompt or independence categories.
- After the session: check the record, enter the value accurately, and update the approved graph.
- When the tool fails: preserve the observed information, mark the limitation, and follow the workplace backup procedure.
- When the plan and form conflict: pause the uncertain choice and contact the supervisor rather than improvising.
That boundary is part of accurate measurement. A confident guess is not better data than an honest missing-data note.
ABA behavior data sheets: a quick study and session checklist
| Check | Question |
|---|---|
| Target | Can another trained observer tell what counts? |
| Unit | Does the sheet match the plan’s frequency, rate, duration, latency, interval, product, or trial measure? |
| Time | Are the observation window, interval length, signal, onset, and offset rules visible? |
| Opportunity | Can the record show how many chances or trials were available? |
| Support | Does the plan require prompt level, independence, or error information? |
| Quality | Is there a way to flag missing data, device failure, or procedure drift? |
| Follow-up | Do you know when and how to report an irregularity to the supervisor? |
Bottom line: ABA behavior data sheets are useful when they make the written measurement plan observable in the moment. Choose the format after identifying the definition, unit, timing, opportunity, and fidelity requirements; enter data exactly as collected; protect the record; and seek supervision before changing the system.
Turn data-sheet choices into exam practice.
Review original RBT measurement scenarios that ask you to match the definition, unit, timing rule, and most defensible next step.
Try RBT practice materials →
Frequently Asked Questions
What are ABA behavior data sheets?
They are structured recording tools used to capture information such as frequency, rate, duration, latency, interval scores, trial responses, permanent products, or ABC observations according to a written plan.
How do I choose an ABA behavior data sheet?
Start with the operational definition and measurement system in the written program. Choose a paper or digital form that can capture the required unit, timing, opportunities, prompts, and exceptions without changing the procedure.
Can an RBT create a new data sheet?
An RBT should use the approved tool and ask the supervisor when a change is needed. The RBT should not independently redesign the measurement system or alter the program because a different template seems easier.
What should be on a behavior data sheet?
Common fields include the approved identifier, date, setting, observer, target and definition, measurement unit, observation time, opportunities, prompt or independence information, raw values, and a way to document missing data or unusual events when required.
Are digital ABA data sheets more accurate than paper?
Not automatically. Digital systems can support timing and calculations, while paper can provide a backup during technology failure. Accuracy depends on a clear plan, correct configuration, consistent implementation, and protected records.
What if the data sheet does not match the written plan?
Do not guess or quietly substitute a measurement. Preserve the information you can collect, document the limitation according to procedure, and contact the supervisor for direction.
References
- Behavior Analyst Certification Board. RBT Test Content Outline (3rd ed.).
- Behavior Analyst Certification Board. RBT Handbook.
- Certified RBT Domain A study guide. Reviewed for competitor research; not an official BACB source.
- Behavior Tech Course ABC data sheet guide. Reviewed for competitor research.
- Praxis Notes ABA data sheets guide. Reviewed for competitor research.
- ABA Notes Pro ABC data guide. Reviewed for competitor research.