
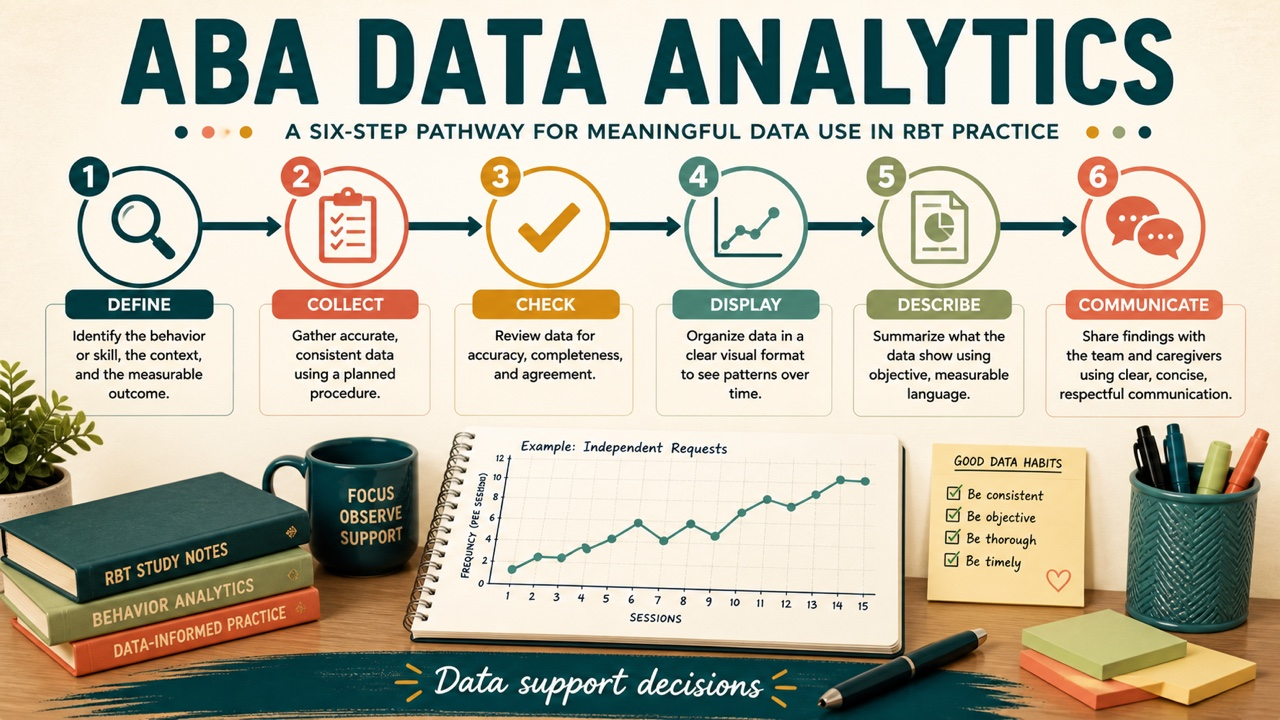
aba data analytics is a useful search phrase for learners who want to understand what happens after behavior data are collected. In RBT work, analytics starts with a trustworthy record and may include organizing, graphing, describing, and reviewing data with the supervising team. It does not mean that an RBT independently diagnoses, selects a function, or changes a treatment plan. This guide explains the study concepts and the boundary between measurement, display, and clinical interpretation.
Table of Contents
- aba data analytics: what the phrase covers
- The data-to-decision chain
- Level, trend, and variability
- Data quality comes before analytics
- How an RBT can support graphing and review
- What analytics does not authorize
- Study workflow for data analytics concepts
- Frequently Asked Questions
- References
Quick answer: Think of analytics as a chain: define the behavior, collect valid observations, check data quality, display the data, describe level/trend/variability, and communicate questions to the supervisor. The more advanced the inference or decision, the more important the written plan and professional direction become.
Study boundary: This is independent exam-preparation content, not an official BACB handbook, certification decision, task answer key, or application determination. The examples in this article are newly written for study. They are not official, recalled, leaked, or BACB-endorsed exam questions. Requirements and policies can change, so use the current BACB handbook and your supervisor or requirements coordinator for decisions about an individual application or client program.
aba data analytics: what the phrase covers
Analytics is broader than making a colorful graph. It asks whether the data answer the intended question, whether the measure stayed consistent, and what pattern is visible without overstating certainty. A graph can show change over sessions, but a graph alone does not reveal every setting event, prompt, staffing change, or implementation error.
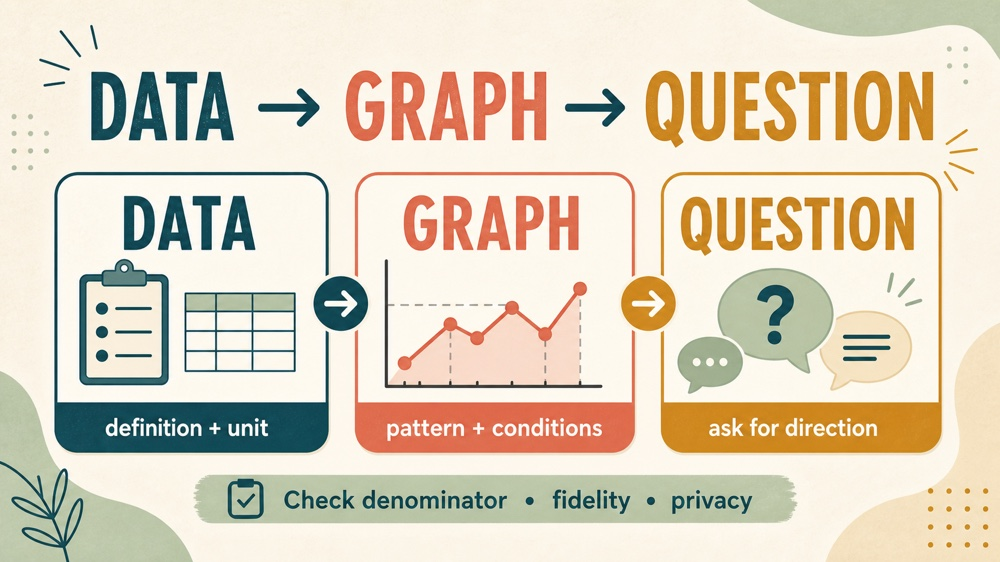
Start by naming the target and unit. A frequency graph, rate graph, duration graph, percentage-of-opportunities graph, and interval-percentage graph may look similar while representing different quantities. Label the measure, denominator, observation window, phase or condition, and any required notes.
The data-to-decision chain
- Define: Use an observable operational definition and stable examples/nonexamples.
- Collect: Follow the authorized procedure, timing, prompt codes, and opportunity rules.
- Check: Look for missing values, impossible entries, denominator changes, and procedural-fidelity concerns.
- Display: Use the graph or table required by the team, with clear labels and dates.
- Describe: Note level, trend, variability, and the conditions represented by the data.
- Communicate: Report observations and questions; leave clinical decisions to the responsible professional.
Level, trend, and variability
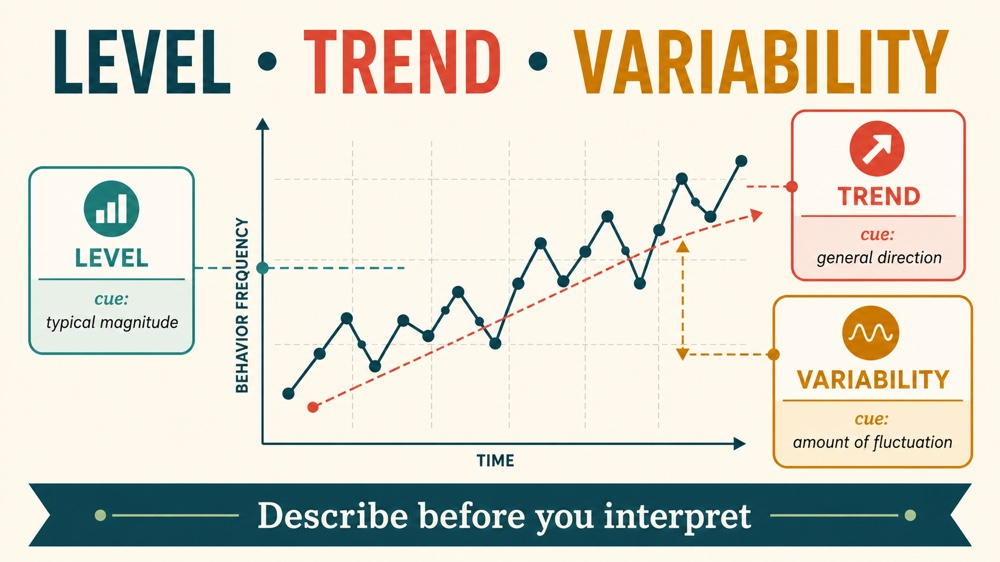
Level is the typical magnitude of data in a phase. Trend is the general direction across time. Variability is the amount of fluctuation around the pattern. These descriptions are more precise than saying “the learner is better” or “the intervention worked.” The team may consider context, fidelity, generalization, maintenance, and other evidence before making a decision.
For example: A learner’s independent responses rise from 4 to 8 across five sessions, but two sessions occurred during a shorter teaching block. An RBT can report the counts, session lengths, prompts, and visible pattern. The supervisor decides whether rate, opportunities correct, or another measure is the proper comparison.
Data quality comes before analytics
| Check | Question | Why it matters |
|---|---|---|
| Definition | Would two trained observers recognize the same response? | Ambiguous targets create scoring drift. |
| Unit | Is the graph showing count, rate, duration, or percentage? | Different units answer different questions. |
| Window | Are sessions comparable in length and opportunities? | Raw totals can mislead when exposure changes. |
| Fidelity | Was the procedure delivered as written? | A pattern may reflect implementation conditions. |
| Privacy | Is the record stored and shared through the approved system? | Clinical data contain confidential information. |
How an RBT can support graphing and review
When trained and authorized, an RBT may enter data, update a graph, check a total, identify a missing field, and describe what was directly observed. Use the template, software, and conventions specified by the organization. Do not backfill a trend from memory or adjust an outlier because it makes the graph look cleaner.
For example: A percentage graph drops on a day when only four opportunities were run instead of ten. Record the denominator and the session condition. Do not state that skill acquisition “regressed” until the team has considered the changed opportunity count and the plan’s interpretation rules.
What analytics does not authorize
An RBT should not independently infer a function, diagnose a condition, change reinforcement schedules, discontinue a safety procedure, or present a correlation as proof of causation. If a graph shows an unexpected pattern, communicate it with the relevant conditions and ask for direction. Data support decisions; they do not grant decision-making authority outside the role.
Study workflow for data analytics concepts
- Rewrite one graph title as a complete sentence naming the measure and unit.
- Calculate a simple rate only when the time denominator is defined.
- Describe a pattern using level, trend, and variability instead of a causal claim.
- Compare a raw count with an opportunities-based percentage and explain why they differ.
- Mark which parts an RBT records and which parts require supervisor interpretation.
Current exam frame: The current RBT Test Content Outline (3rd ed.) applies beginning January 1, 2026. It describes 43 tasks across six content domains. The current examination format is 75 scored questions plus 10 unscored pilot questions, four answer choices per item, and a 90-minute testing period. These facts explain the study frame; they do not turn an independent guide into an official BACB resource.
For study, trace every practice scenario from definition to decision. If a step changes the program or makes a clinical inference, label it as a supervisor-level question rather than an RBT implementation step.
Practice data interpretation safely
Use independent RBT-style examples to practice measurement and graph-reading language, then check clinical decisions with your supervising team.
Review the RBT resource →
Frequently Asked Questions
What is aba data analytics in RBT study?
It is the organized review of defined behavior data, including quality checks, displays, descriptive patterns, and communication with the supervising team.
Is graphing the same as clinical interpretation?
No. Graphing displays observations. Clinical interpretation and plan changes require the responsible professional’s direction.
What should an RBT do when a graph changes unexpectedly?
Check the record and conditions, document what was observed, and communicate the pattern through the approved supervision route.
Why do denominators matter?
A count, rate, and percentage can describe the same session differently. The denominator and observation window must match the written measurement plan.
Are these official BACB questions?
No. The examples are newly written independent study content and are not official, recalled, leaked, or BACB-endorsed exam questions.