The RBT 2025 40 hour training pass rates report is a BACB data resource about first-time RBT examination candidates associated with publicly available 40-hour training providers. It is useful for reading published outcomes, but it is not a ranking of every course, a prediction of your personal score, or proof that one training provider causes a particular result. This guide explains the report’s inclusion rules, the numbers in each row, how to compare providers responsibly, and what the report cannot answer.
Table of Contents
- What the RBT 2025 40 hour training pass rates report is
- How the RBT 2025 40 hour training pass rates report chooses providers
- How to read each provider row
- Why sample size changes the interpretation
- RBT 2025 40 hour training pass rates versus the overall RBT pass rate
- How to use the report when comparing training options
- What the report does not prove
- Frequently asked questions
- Official sources and scope
RBT training data explainer
RBT 2025 40-Hour Training Pass Rates: How to Read the Data
Understand what BACB’s provider report measures, how to read a row, and why a published percentage is not a personal guarantee.
If you are searching for RBT 2025 40 hour training pass rates, the report behind that query is a BACB data resource about first-time RBT examination candidates associated with publicly available 40-hour training providers. It can help you understand reported outcomes and ask better questions before choosing a course.
It should not be read as a guarantee, a complete ranking of every course, or proof that a provider caused a particular result. The report has a defined population, a publication threshold, and several important timing and attribution limits. Reading those limits is just as important as reading the percentage.
What the RBT 2025 40 hour training pass rates report is
BACB’s report is titled RBT Examination Pass Rates for 40-Hour Training Providers 2025. The report was updated in May 2026 and presents first-time RBT examination outcomes for training programs that met BACB’s publication criteria.
That wording matters. The report is not a survey asking whether learners liked a course. It is not an evaluation of teaching style, accessibility, instructor feedback, or the full learner experience. It is a report of examination outcomes connected to provider names entered by applicants. Pass rate is one data point, not a complete quality score.
The report also separates “first-time” examination outcomes from retake outcomes. A first-time candidate is not the same population as every candidate who tested, so this provider report should not be mixed casually with an annual report that includes a different denominator.
How the RBT 2025 40 hour training pass rates report chooses providers
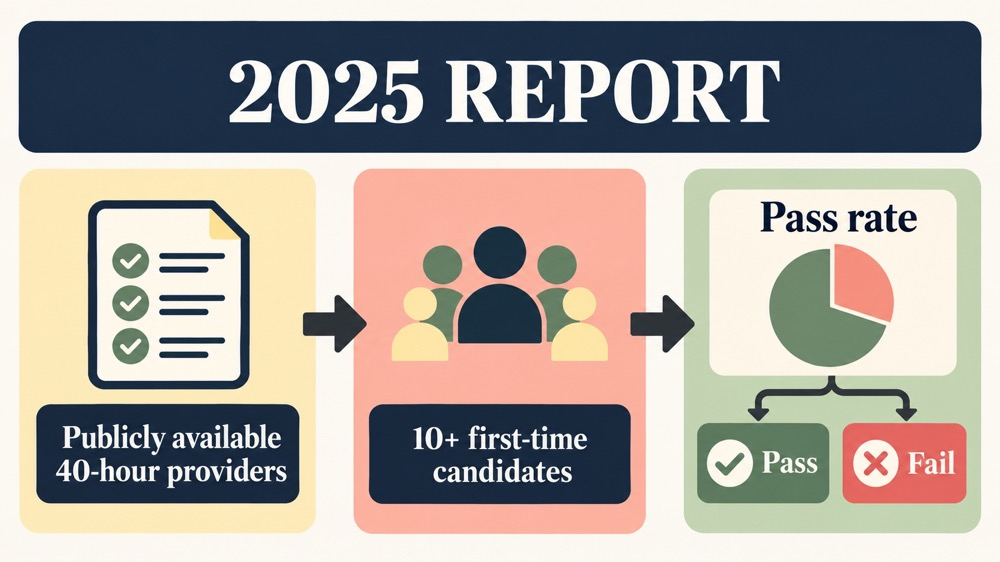
BACB says the 2025 report includes training programs that were publicly available at the time of publication and had 10 or more first-time RBT examination candidates in 2025. This gives the table a clear inclusion rule, but it also creates a boundary around what the report can show.
A provider with fewer than 10 first-time candidates may not appear. A private course or a course that was not publicly available at the relevant time may not appear. The absence of a provider from the report therefore does not automatically mean that the provider has no learners, no outcomes, or poor quality. It may simply mean that the program did not meet the report’s criteria.
BACB also explains that the names are based on what applicants entered when they applied. A candidate may complete a 40-hour training in one year, apply in another year, and test later. BACB warns that those records may not match a training provider’s internal records exactly. That is a reason to interpret the report as a standardized public data snapshot rather than a perfect audit of every graduate.
How to read each provider row
The official PDF uses five practical columns. Read them together rather than looking at the percentage alone:
- Training Provider: the provider name associated with applicants’ entries.
- Pass Rate (%): the share of the listed first-time candidates who passed.
- Total First-Time Candidates (N): the number of first-time candidates included for that provider.
- First-Time Pass (N): the count of candidates who passed.
- First-Time Fail (N): the count of candidates who did not pass on that first attempt.
For example, the report lists Behavior Development Solutions at 93.5%, with 923 first-time candidates, 863 first-time passes, and 60 first-time fails. It lists CentralReach at 79.6%, with 13,705 candidates, 10,912 passes, and 2,793 fails. These rows do not answer every question about either provider, but the counts help you understand the scale behind the percentage.
The report also lists smaller groups. Northern Michigan University Bear Center appears at 100.0% with 18 candidates, while the Center for Behavior Analysis at the University of West Florida appears at 100.0% with 12 candidates. A 100% rate is mathematically clear, but it does not mean that 100% of all future learners will pass. The sample count and the time period remain part of the result.
Why sample size changes the interpretation
Suppose one provider has 10 first-time candidates and all 10 pass. Its reported rate is 100%. Another provider has 1,000 first-time candidates and 900 pass. Its reported rate is 90%. The first percentage is higher, but the second row represents a much larger group and may give a different kind of evidence about repeated outcomes.
This does not make a large provider automatically better. Larger programs can serve different learners, use different support models, and have different enrollment patterns. It simply means that percentage and denominator should be read together. A responsible comparison asks: How many first-time candidates are represented? What year does the report cover? Are the providers serving similar audiences? What other information matters for the learner’s needs?
Also look at the difference between pass and fail counts. A row can show a high percentage and still include people who did not pass. Conversely, a moderate percentage may represent a provider with many successful candidates even though the percentage is not near 100%. The counts prevent a percentage from becoming a slogan.
RBT 2025 40 hour training pass rates versus the overall RBT pass rate
BACB’s separate 2025 Annual Data Report lists an overall first-time RBT examination pass rate of 75% for 109,341 first-time candidates. That is useful context, but it is not the same statistic as the 40-hour provider report.
The overall annual figure covers the RBT testing population described in BACB’s annual report. The provider report covers first-time candidates associated with publicly available 40-hour providers meeting the 10-candidate threshold and displays provider-level rows. The populations, inclusion rules, and reporting purpose differ. You can compare them as context, but you should not treat one as a simple replacement for the other.
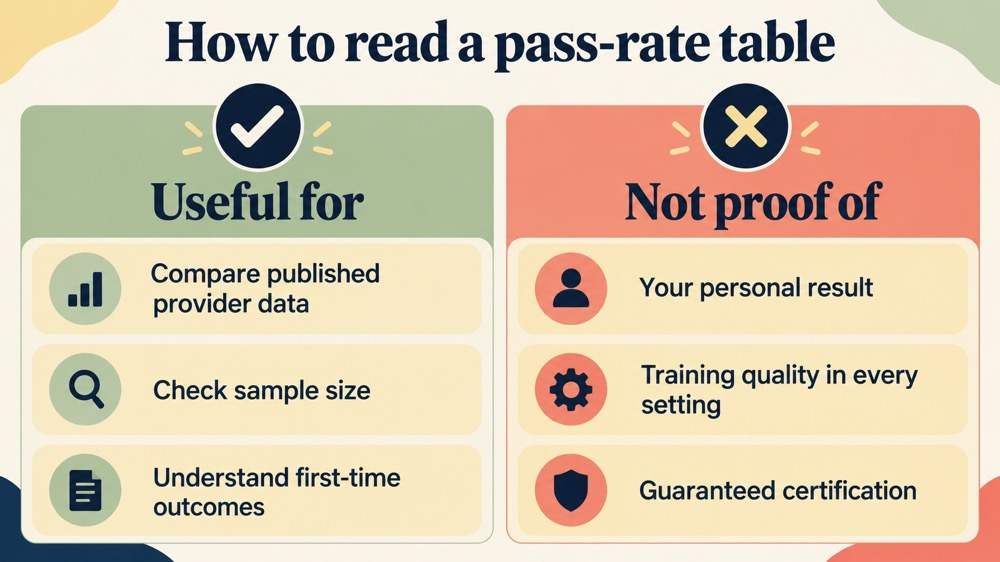
This distinction is especially important when someone says, “My course has a 90% pass rate, so I have a 90% chance of passing.” The provider figure is a historical group result. Your preparation, prior knowledge, test conditions, accommodations, timing, and other factors are not converted into a personal probability by that table.
How to use the report when comparing training options
If you are choosing or reviewing a 40-hour training option, the report can be one part of a broader checklist:
- Confirm the course is relevant to the current pathway. Check the live BACB requirements and the current training information, not only an old sales page.
- Read the provider’s support model. Ask whether learners receive explanations, practice opportunities, technical support, and clear instructions for completing the training.
- Check what the percentage actually covers. Ask for the year, first-time denominator, and whether the provider’s internal definition matches BACB’s public report.
- Look at fit and access. Consider schedule, language, accessibility, device requirements, pace, and whether the format supports the way you learn.
- Plan the next requirements. A 40-hour course is one part of the RBT pathway. Review the current Handbook, competency assessment, application, examination, and supervision steps.
- Use pass-rate data as a question starter. Ask what the provider does to help learners understand concepts and apply them accurately, rather than choosing only the highest published percentage.
For a learner already enrolled, the table is not a reason to panic if your provider’s percentage is lower than another provider’s. Use it to identify questions, then focus on the current content, practice, feedback, and role-appropriate preparation that you can control.
What the report does not prove
The RBT 2025 40-hour training pass rates report does not prove that:
- a provider caused every listed examination outcome;
- the percentage applies to every learner, location, course version, or future year;
- a provider missing from the report has poor training or no successful candidates;
- the highest percentage is the best choice for every learner;
- passing the examination alone completes every certification or supervision requirement; or
- the report replaces the current RBT Handbook, training requirements, competency assessment, Ethics Code, or BACB instructions.
It also does not measure every part of training quality. Pass rates do not directly show instructional clarity, response time, accessibility, learner satisfaction, transfer to practice, or support after a learner finishes the course. Those questions require additional evidence and direct communication with the provider.
Frequently asked questions
What does the 2025 RBT 40-hour provider report measure?
It reports first-time RBT examination outcomes associated with publicly available 40-hour training providers that had at least 10 first-time candidates in 2025. It lists provider-level pass and fail counts and the resulting pass rate.
Does a 100% provider pass rate guarantee that I will pass?
No. It describes the reported group in that year and sample. It is not a personal guarantee or a promise about future candidates.
Why is a provider not listed?
The provider may not have met one of the publication criteria, including public availability or at least 10 first-time candidates in 2025. The report’s absence rule should not be turned into a quality judgment.
Is the provider report the same as BACB’s overall RBT pass rate?
No. The provider report and the annual data report use different populations and reporting rules. Read each source’s definition before comparing the numbers.
What should I ask a training provider about its pass rate?
Ask which year the rate covers, how many first-time candidates are included, whether the number comes from BACB’s public report or the provider’s own records, and what learner support is included beyond the percentage.
Official sources and scope
This guide was checked against BACB’s 2025 provider-report announcement, the official 2025 pass-rate PDF, the 2025 Annual Data Report, and BACB’s RBT resource page. Reports and requirements can change, so use the live BACB sources for current decisions.
Ready to practice the RBT concepts you just reviewed?
Try an independent, original RBT practice resource with exam-style questions, scoring, and answer explanations.
References
- Behavior Analyst Certification Board. RBT Test Content Outline, 3rd edition.
- Behavior Analyst Certification Board. RBT Handbook.
- Behavior Analyst Certification Board. RBT Ethics Code.