
ABA data sheets are not just blank forms to fill in. A useful sheet connects an observable behavior to an operational definition, a measurement system, an observation window, response codes, and a place to record enough context for the team to review the data.
Table of Contents
- ABA data sheets: what belongs on every form
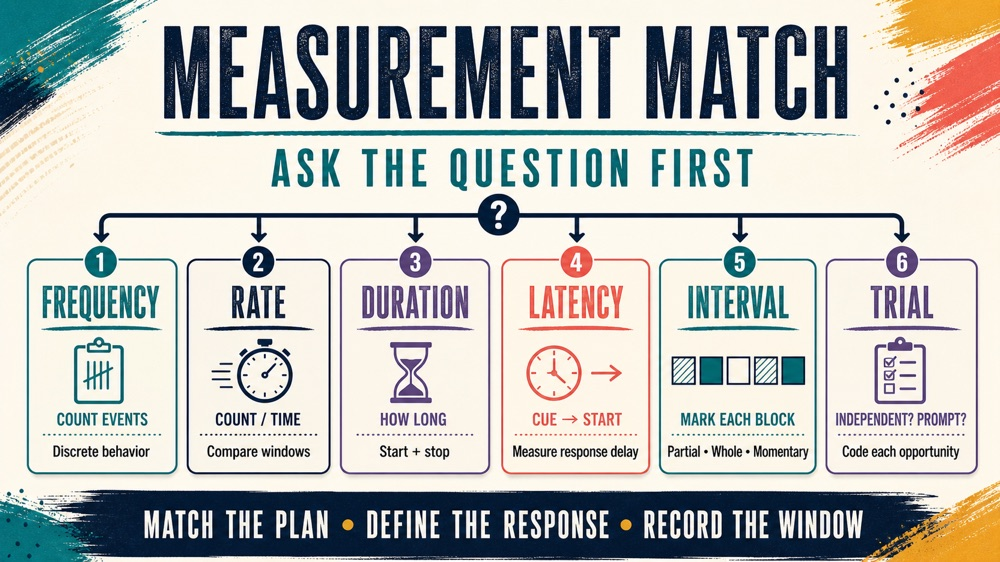
- ABA data sheets: choose the system from the behavior question
- How to fill ABA data sheets for frequency and rate
- How to fill duration and latency data sheets
- How to use interval recording sheets
- How to use trial-by-trial ABA data sheets for skills
- How ABC notes fit with direct measurement
- Use a four-stage ABA data sheet quality check
- Map ABA data sheets to the six RBT domains
- Use a seven-day ABA data sheets practice plan
- Frequently Asked Questions
- References
For an RBT candidate, the key question is not “Which template looks professional?” It is “What question is this sheet designed to answer, and does the procedure match the written plan?” Frequency, rate, duration, latency, interval, trial-by-trial, and ABC recording produce different kinds of information. A neat spreadsheet can still produce a misleading number if the method is wrong.
The current RBT examination is based on the RBT Test Content Outline, 3rd edition, which describes 43 tasks across six domains. The exam has 85 multiple-choice questions, including 75 scored questions and 10 unscored questions, with four possible answers per question and 90 minutes. This guide uses original examples for study and does not reproduce protected examination content.
This is independent educational content. RBT Training is not the BACB, is not a certification program, and is not affiliated with or endorsed by the BACB. Examples below are newly written and are not official, recalled, leaked, or BACB-endorsed questions. An RBT follows the written plan and supervision structure; an RBT should not independently redesign a client’s measurement system or treatment.
These resources cannot guarantee certification or a passing result.
ABA data sheets: what belongs on every form
The exact layout can be paper, digital, or a program-specific interface. The essential information is the same: enough detail to know what was measured, when it was measured, and how the observer scored it.
| Field | Why it matters | Common failure |
|---|---|---|
| Client or learner identifier | Connects the record to the correct case while protecting privacy. | Using a public full name or mixing records. |
| Target behavior or skill | States what is being observed. | Writing “noncompliance” or “good communication” without an observable definition. |
| Operational definition | Sets the boundary for what counts and what does not. | Changing the definition from one session to the next. |
| Measurement system | Explains whether the sheet records count, time, intervals, latency, or trials. | Using a frequency form for a continuous episode without direction. |
| Observation window | Provides the time or number of opportunities needed to interpret the total. | Comparing a 20-minute session with a 60-minute session as raw counts. |
| Response codes and examples | Helps observers score the same way. | Using an undocumented “+” or “-” that means different things to different people. |
| Observer, date, setting, and activity | Provides context for trend review and data-quality checks. | Leaving out the activity when behavior varies by context. |
| Summary and notes | Records totals, rate or percentage, unusual variables, and required communication. | Replacing data with a subjective session grade. |
Do not add fields merely because a form has space. A form that is too crowded can make data collection infeasible. Ask whether each field supports the written program, the measurement question, or required documentation. If you do not know, pause and ask the supervisor before changing the sheet.
ABA data sheets: choose the system from the behavior question
Start with the dimension of behavior the team needs to see. “How often?” “How long?” “How quickly?” “Was it present during a sample?” and “Was the skill independent?” are different questions.
| If the question is… | Possible system | What the sheet records |
|---|---|---|
| How many discrete events occurred? | Frequency or event recording | A count during a defined observation period. |
| How many events per unit of time? | Rate | Frequency divided by the observation time. |
| How long did each episode last? | Duration | Start, end, and elapsed time for each episode. |
| How long until the response began? | Latency | Time from the stated cue or event to response onset. |
| How far apart were responses? | Interresponse time | Time between the end or occurrence of one response and the next, as defined. |
| Was behavior present in a time sample? | Partial, whole, or momentary interval recording | A mark for each predetermined interval under one rule. |
| Was a teaching response independent or prompted? | Trial-by-trial recording | Response, prompt level, consequence, and error code for each opportunity. |
| What happened before and after an event? | ABC recording | Objective antecedent, behavior, and consequence observations. |
There is no universally best sheet. A method is useful only if it matches the operational definition, the behavior’s pattern, the setting, the observer’s capacity, and the question the team is trying to answer. In an active session, a complex form may create more missing data than a simpler plan-approved form.
How to fill ABA data sheets for frequency and rate
Frequency or event recording counts each occurrence of a clearly defined, discrete behavior during a specified period. Rate puts that count in relation to time, which is important when session lengths differ.
Original example: the written plan defines “request” as a vocal or signed response that names or indicates a desired item within the opportunity. During a 30-minute observation, the observer records 6 independent requests. Frequency is 6. Rate is 6 divided by 30 minutes, or 0.2 requests per minute, which is 12 requests per hour if that conversion is useful for the plan.
The calculation does not make the number clinically meaningful by itself. The observer still needs the operational definition, opportunity structure, setting, and whether prompted responses are counted separately. If a second session lasts 60 minutes and has 9 requests, the raw frequency is higher but the hourly rate is lower: 9 per 60 minutes equals 9 per hour. Comparing the counts alone could tell the wrong story.
Record zero when zero is the observed result and the written system requires it. A blank cell can mean “no behavior,” “missed observation,” “not applicable,” or “forgot to enter data.” Those are not interchangeable. Use the code specified by the program and note interruptions or missing observation time.
For the RBT exam, watch for distractors that confuse frequency with rate, or that treat a count without its observation period as a complete comparison. Also watch for a behavior that has no clear beginning and end; counting every occurrence may not be feasible or may answer a less useful question.
How to fill duration and latency data sheets
Duration recording measures how long behavior lasts. It requires a defined start and stop. Latency recording measures the time between a specified event, such as an instruction, and the beginning of the response. Both use time, but they answer different questions.
| Measure | Original scenario | Correct entry |
|---|---|---|
| Duration | Three episodes last 40, 25, and 55 seconds. | Record each episode and total duration of 120 seconds; do not replace it with a count of 3. |
| Latency | After an instruction, response begins after 8, 12, and 5 seconds. | Record each instruction-to-onset interval; do not call the longest response duration. |
| Interresponse time | Two responses occur 18 seconds apart under the stated definition. | Record the interval between responses; do not treat it as latency unless the cue is the reference event. |
Write times in the unit required by the form. A stopwatch or timer can reduce guessing, but the observer still needs a consistent event definition. If the target behavior never ends, ask what the plan says to do; do not invent an end point just to complete a blank.
Duration can hide frequency. Ten minutes of one episode is not the same pattern as ten one-minute episodes, even though total duration is equal. Frequency can hide duration. A single 10-minute episode and a single 10-second episode both produce a count of 1. That is why the chosen measure should follow the team’s question.
How to use interval recording sheets
Interval recording divides an observation period into predetermined intervals and applies one scoring rule to each interval. The three common variants are not interchangeable:
| Variant | Mark the interval when… | Study caution |
|---|---|---|
| Partial interval | The behavior occurred at any point during the interval. | Brief behavior can make the percentage look high because one moment marks the whole interval. |
| Whole interval | The behavior occurred for the entire interval. | Behavior that occurs for most but not all of the interval is not scored as a whole interval. |
| Momentary time sampling | The behavior is occurring at the specific check point, usually the end of the interval. | It does not ask whether the behavior occurred at any time during the entire interval. |
Original example: a 10-minute observation is divided into ten 1-minute intervals. Under partial-interval recording, the behavior appears in 4 intervals, so the sheet can show 40% of intervals with occurrence. That percentage is not automatically 40% of the total time and should not be relabeled as duration.
Use a timer or predetermined cues when the plan requires them. Missing one interval is not the same as a negative interval. Mark the missing-data code and follow the program’s instructions. If the behavior is too frequent to score reliably while implementing a teaching procedure, raise the feasibility problem rather than silently changing the system.
How to use trial-by-trial ABA data sheets for skills
Trial-by-trial recording is useful when the team wants to see performance across teaching opportunities. A sheet may include the discriminative stimulus, learner response, prompt level, consequence, error code, and whether the response was independent.
Original example: across 10 opportunities, the learner gives 6 independent responses, 3 responses after a verbal prompt, and 1 no response. The summary should preserve those categories. Reporting only “9 correct” would hide prompt dependence. If the plan defines prompted responses differently, use the plan’s codes rather than the example’s labels.
When a prompt is delivered before the learner has a chance to respond, the trial may not be comparable to an independent opportunity. Record the actual prompt level and follow the written prompting and fading procedure. An RBT should not increase, decrease, or remove prompts because the data sheet makes one choice look better.
For exam study, distinguish accuracy, independence, prompt level, and opportunities. A higher percentage can result from more prompting, a shorter response requirement, or fewer difficult trials. Ask what the numerator and denominator actually represent.
How ABC notes fit with direct measurement
ABC recording describes what happened before a behavior, the observable behavior itself, and what followed. It can help the supervising team review patterns, but it is not a license to write assumptions as facts.
| Record as observation | Avoid writing as certainty |
|---|---|
| “Instruction to put blocks away was delivered; learner pushed blocks to the floor; staff repeated the instruction and provided a two-minute break.” | “The learner pushed blocks to escape because the break reinforced it.” |
| “Caregiver entered; learner cried for 30 seconds; caregiver moved closer.” | “The learner wanted attention.” |
| “Tablet was removed; learner reached toward the shelf; technician followed the written transition plan.” | “The tablet caused the behavior.” |
Objective ABC notes and direct measurement can appear on the same form, but they answer different questions. Record the required fields, use the operational definition, and route interpretation or plan changes to the supervisor.
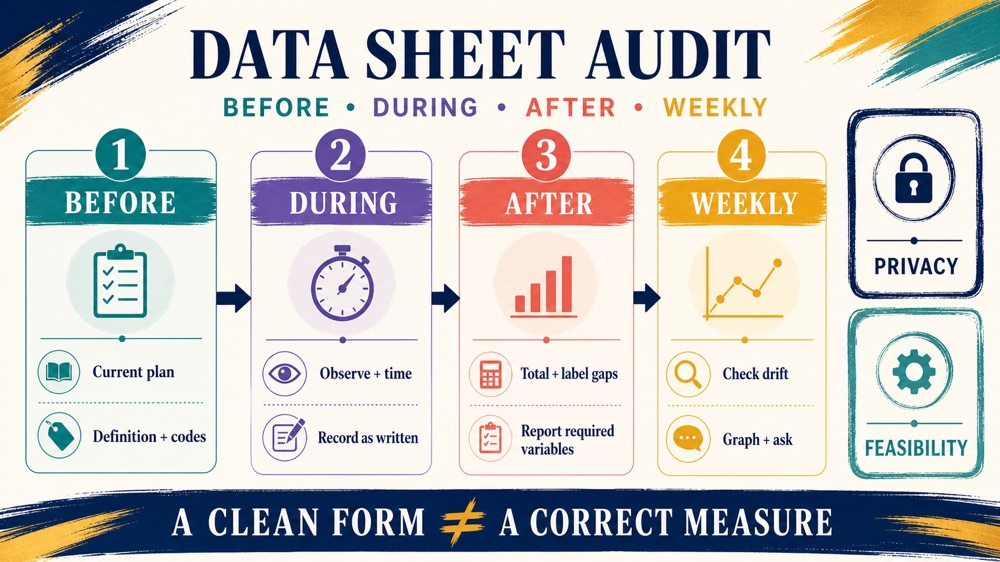
Use a four-stage ABA data sheet quality check
- Before the session: confirm the current program version, target definition, measurement system, response codes, timing device, and required privacy controls.
- During the session: collect data at the stated opportunities or intervals, mark prompts and interruptions, and avoid filling gaps from memory later.
- After the session: total the entries, calculate only the summary the form requests, label missing data, complete the note, and communicate required variables.
- Weekly review: check for definition drift, impossible totals, inconsistent zeros, unexplained changes in session length, and patterns that need supervisor review.
Look for arithmetic and logic errors. If a 20-minute session has 25 one-minute intervals, the form or entry needs review. If the number of independent trials exceeds the total number of trials, check the codes. If the graph changes suddenly when the observer or form changes, document the change before interpreting a trend.
Data quality also includes feasibility and dignity. A sheet that forces an observer to look away from a safety-relevant event is not automatically good because it produces many numbers. The written plan and supervisor should determine how to balance measurement with safe implementation.
Map ABA data sheets to the six RBT domains
Domain A is the direct measurement and graphing center of gravity, but data-sheet judgment appears throughout the TCO:
| Domain | Question a data sheet helps answer | RBT boundary |
|---|---|---|
| A. Data Collection and Graphing | Which measure, unit, graph, and data-quality check fit the observation? | Collect and record as written; do not invent a new system. |
| B. Behavior Assessment | What objective antecedent, behavior, consequence, or preference information was observed? | Report observations without independently declaring function. |
| C. Behavior Acquisition | How many opportunities, responses, prompts, and reinforcers occurred? | Follow the teaching and prompt-fading plan. |
| D. Behavior Reduction | What target or replacement behavior occurred under the written procedure? | Follow behavior-reduction and safety directions. |
| E. Documentation and Reporting | What objective data and relevant variables belong in the record? | Protect accuracy, timeliness, and confidentiality. |
| F. Ethics | Who can access the form and how should an uncertainty be escalated? | Protect privacy, dignity, competence, and supervision. |
The current TCO lists 13 questions for Domain A, 8 for B, 19 for C, 14 for D, 10 for E, and 11 for F. These are exam blueprint percentages, not permission to skip a lower-count area. A data-sheet question can also test documentation, ethics, or scope of practice.
Use a seven-day ABA data sheets practice plan
- Day 1: label the behavior dimension in ten original scenarios: count, rate, duration, latency, interval, trial, or ABC.
- Day 2: complete frequency and rate calculations with varied observation lengths; check units.
- Day 3: practice duration, latency, and interresponse-time examples; draw start and stop events.
- Day 4: compare partial interval, whole interval, and momentary time sampling with the same short scenario.
- Day 5: complete trial-by-trial and ABC examples; separate observation from interpretation.
- Day 6: audit a blank form for definition, codes, time window, privacy, and arithmetic feasibility.
- Day 7: complete a mixed original set and explain what the RBT should do when the written plan or sheet is unclear.
Bottom line: the best ABA data sheets make the observation question visible. Match the form to the behavior dimension, define the response, record the time window and codes, calculate only what the procedure supports, and ask for supervision before changing the system. A completed sheet is evidence; it is not automatically a valid measurement or a treatment decision.
Practice RBT measurement decisions
Use original data-collection scenarios to see which measurement concept needs review next.
Try Free RBT Practice Questions →
Frequently Asked Questions
What are ABA data sheets?
ABA data sheets are structured records for observing and documenting behavior or skill performance. A useful sheet identifies the target, operational definition, measurement system, observation window, response codes, context, and required summary fields.
What is the difference between frequency and rate?
Frequency is the number of events observed. Rate places that count over a unit of time, such as responses per minute or hour. Rate is especially useful when observation sessions are different lengths.
When should an RBT use duration recording?
Use the duration procedure specified in the written plan when the length of a behavior or skill matters. Record defined start and stop events and do not substitute duration for frequency without direction.
Are partial interval and whole interval the same?
No. Partial interval marks an interval when the behavior occurs at any point, while whole interval requires the behavior to occur throughout the entire interval. Momentary time sampling checks behavior at a specific moment.
Can an RBT create or change a client data sheet?
An RBT may use the form and give feedback about feasibility, but should follow the written plan and supervision structure. Ask before changing definitions, codes, timing, or the measurement system.
Does a completed data sheet prove that treatment worked?
No. It is one record collected under a procedure. The team must review data quality, context, graph patterns, and the written plan before making clinical decisions.
References
- Behavior Analyst Certification Board. RBT Handbook.
- Behavior Analyst Certification Board. Examination Information.
- Behavior Analyst Certification Board. RBT Test Content Outline (3rd ed.).
- Behavior Analyst Certification Board. RBT 3rd-Edition Test Content Outline PDF.
- Vanderbilt University IRIS Center. Implementation and Progress Monitoring.
- University of Connecticut. How to Record Single-Subject Research Data.
- Ensora ABA data collection methods. Reviewed for competitor research; not an endorsement.
- Kipr ABA data collection systems. Reviewed for competitor research; not an endorsement.
- RBT Practical Application Worksheets. Reviewed for competitor research; not an endorsement.