

If you are preparing for the RBT exam and wonder why data collection is an important part of ABA, start with the practical answer: data makes behavior visible in a consistent way. It helps the supervising team compare what happened across sessions, evaluate whether a written plan is producing the intended change, and notice when the measurement procedure itself is unreliable.
Table of Contents
- Why data collection is an important part of ABA
- Why data collection is an important part of ABA: the data-to-decision chain
- Choose the measurement written in the plan
- Observable and measurable definitions come first
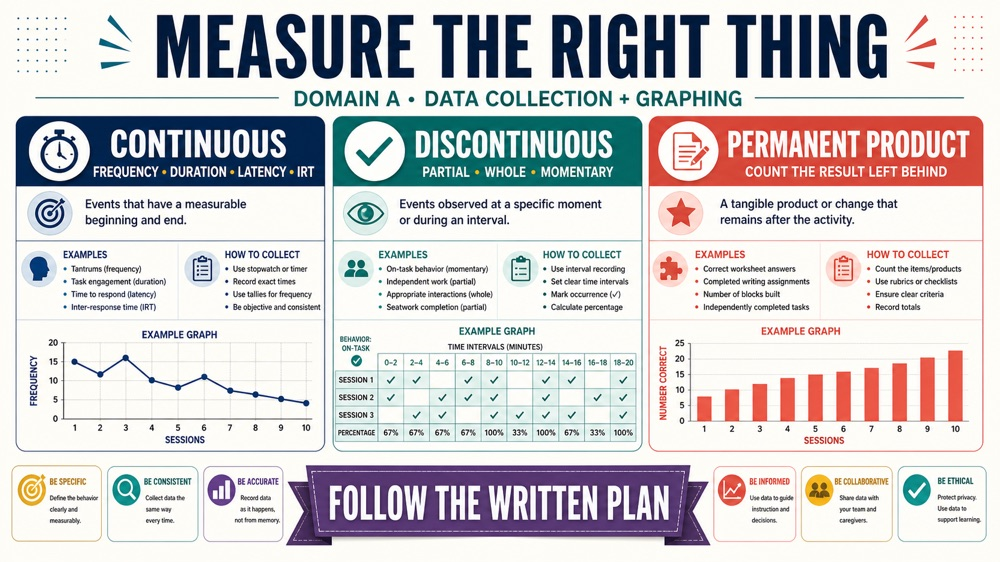
- Continuous measurement: record every relevant occurrence
- Discontinuous measurement: the interval rule changes the meaning
- Permanent product: measure the result left behind
- Why data collection is an important part of ABA: what makes data reliable?
- From session record to graph trend
- The RBT role: collect, check, communicate, and follow the plan
- Why data collection is an important part of ABA: a Domain A study checklist
- Frequently Asked Questions
- References
Data is not a decorative number added after a session. It is a record of observable events, skill responses, or products that lets the team reason from evidence instead of memory or impressions. But data only helps when the operational definition, measurement system, recording procedure, and graph entry are aligned. A precise-looking number collected with the wrong rule can still mislead the team.
The current RBT Test Content Outline (3rd ed.) organizes Domain A as Data Collection and Graphing and includes eight tasks: continuous measurement, discontinuous measurement, permanent product, data entry and graphs, observable and measurable descriptions, calculations and summaries, graph trends, and risks of unreliable data or poor procedural fidelity. The outline contains 43 tasks across six domains; Domain A represents 13 of the 75 scored questions, while the exam also presents 10 unscored pilot questions. RBT Training’s examples are independent, newly written study content—not official, recalled, leaked, or BACB-endorsed questions.
This guide explains why data matters, how an RBT can collect it reliably, and what to do when the data or the plan does not make sense. It does not authorize anyone to change a clinical program or replace supervision. No article, study guide, or practice score can guarantee certification or a passing result.
Why data collection is an important part of ABA
Applied behavior analysis focuses on behavior that can be observed and measured. Data gives the team a shared record of that behavior. Instead of saying “the learner did better today,” a team can ask a more useful question: what was measured, under what conditions, and how did the value compare with the learner’s earlier performance?
| Without a usable record | With consistent data |
|---|---|
| A remembered impression may overemphasize an unusual event. | The team can compare repeated observations over time. |
| A change in behavior may be confused with a change in setting or opportunity. | The team can examine context, opportunities, and the written procedure. |
| A treatment decision may be made before anyone checks whether the measurement was applied correctly. | The supervisor can investigate data quality and procedural fidelity. |
| Different staff may use different meanings for the same label. | An operational definition and recording rule create a common standard. |
Data does not decide everything by itself. The supervisor interprets data in the context of the plan, client goals, setting events, measurement limits, and other relevant information. The RBT’s job is to make the record as accurate and objective as possible and to communicate concerns promptly.
Why data collection is an important part of ABA: the data-to-decision chain
A useful study model is a six-link chain. A break at any link can weaken the conclusion:
- Definition: describe the target behavior or skill in observable and measurable terms.
- Measure: use the frequency, duration, latency, interval, permanent-product, or other system named in the plan.
- Opportunity: record the relevant opportunities, observation period, or trial structure.
- Entry: transfer the session values accurately to the data sheet or approved system.
- Graph: update the graph using the correct axis, phase, value, and date.
- Review: the supervising team examines level, trend, variability, context, and fidelity before making a clinical decision.
For example: “compliance improved” is too vague to audit. “Across 10 presented instructions, the learner began the requested response within 10 seconds on 8 opportunities” gives a clearer record, provided the plan defines the response, latency rule, opportunity window, and recording procedure.
Choose the measurement written in the plan
One of the most important reasons data collection is an important part of ABA is that the same behavior can look different under different measurement systems. The right choice depends on the target, the goal, the setting, and the procedure selected by the supervisor. An RBT should not switch from one system to another simply because a different number feels easier to collect.
| Measurement | Question it answers | Mini-example |
|---|---|---|
| Frequency | How many times did the behavior occur? | Hand raising occurred 6 times during a 30-minute lesson. |
| Rate | How often did it occur relative to time? | 6 hand raises in 30 minutes = 0.2 per minute. |
| Duration | How long did the behavior last? | A crying episode lasted 4 minutes from onset to offset. |
| Latency | How long from the instruction or event to response onset? | The learner began the task 8 seconds after the instruction. |
| Interresponse time | How much time passed between two responses? | There were 20 seconds between two independent requests. |
| Discontinuous measurement | Did the behavior meet the interval rule? | Partial interval records whether it occurred at any point in the interval. |
| Permanent product | What observable product remains after the behavior? | Number of completed worksheet items is counted after the session. |
Notice that frequency and rate are not interchangeable. Six responses in 30 minutes and six responses in 5 minutes have the same frequency but different rates. Likewise, duration tells you how long an episode lasted, not how many episodes occurred. These distinctions are common exam decision points.
Observable and measurable definitions come first
An operational definition tells the observer what counts and what does not count. “Aggression,” “noncompliance,” or “being upset” can be useful everyday labels, but they do not tell two observers exactly what to record. A stronger definition describes an observable topography, the start and stop rule, and relevant examples or nonexamples.
| Weak description | More observable description |
|---|---|
| “The learner was disruptive.” | “The learner pushed classroom materials off the table with one or both hands.” |
| “The learner was on task.” | “The learner oriented toward the assigned worksheet, held a pencil, and wrote or selected an answer during the defined observation period.” |
| “The learner had a meltdown.” | “The learner cried with audible vocalizations above conversational volume and dropped to the floor for at least 10 consecutive seconds.” |
A definition is not automatically correct because it sounds professional. Ask whether another trained observer could apply it consistently and whether the plan gives the measurement procedure that fits it. If the definition or boundary is unclear, document the question and contact the supervisor rather than inventing a private rule.
Continuous measurement: record every relevant occurrence
Continuous measurement records each occurrence or the relevant continuous property of the behavior during the observation period. The current TCO examples include frequency, duration, latency, and interresponse time. Continuous measurement is useful when the behavior can be observed and recorded as it occurs and when the plan calls for complete recording.
Scenario: the plan defines a request as a spoken or aided response that occurs within 10 seconds of an item being visible. During a 20-minute session, the learner makes 12 defined requests. The RBT records 12—not “about a dozen”—and follows the plan’s rules for prompted versus independent requests. If the device fails for part of the session, the RBT records the limitation and reports it instead of estimating the missing values.
Continuous does not mean “write down every impression.” It means use the stated event, time, or response rule consistently. A timer, clicker, data sheet, or digital system can support recording, but the tool does not replace an operational definition.
Discontinuous measurement: the interval rule changes the meaning
Discontinuous systems sample behavior rather than recording every occurrence. Partial-interval recording marks an interval when the behavior happened at any point; whole-interval recording marks it only when the behavior happened for the entire interval; momentary time sampling checks whether it is occurring at the specified moment. The observer must follow the interval rule exactly.
| System | Record “yes” when… | Common interpretation caution |
|---|---|---|
| Partial interval | The behavior occurred at least once during the interval. | Can overestimate duration or continuous occurrence. |
| Whole interval | The behavior occurred throughout the entire interval. | Can underestimate behavior that is present but interrupted. |
| Momentary time sampling | The behavior is occurring at the specified check moment. | Misses behavior that occurs between check moments. |
Example: during a 10-second interval, the learner looks away for 2 seconds. Partial interval may be marked yes; whole interval is no; momentary time sampling depends on whether the learner is looking away at the check moment. The same observation can produce different values because the rules answer different questions.
Permanent product: measure the result left behind
Permanent-product recording measures an observable product that remains after the behavior, such as completed items, correctly sorted cards, or a finished written response. It can be efficient when the product reliably represents the target behavior and the plan specifies what counts. The product must not be treated as proof of an unobserved process if the plan does not establish that link.
Scenario: a worksheet has 20 items. The plan defines a completed item as a response written in the answer box before the end of the work period. The RBT counts completed items using that rule. The RBT does not infer that every completed item was independent unless the plan includes a way to record prompts or independence.
Why data collection is an important part of ABA: what makes data reliable?
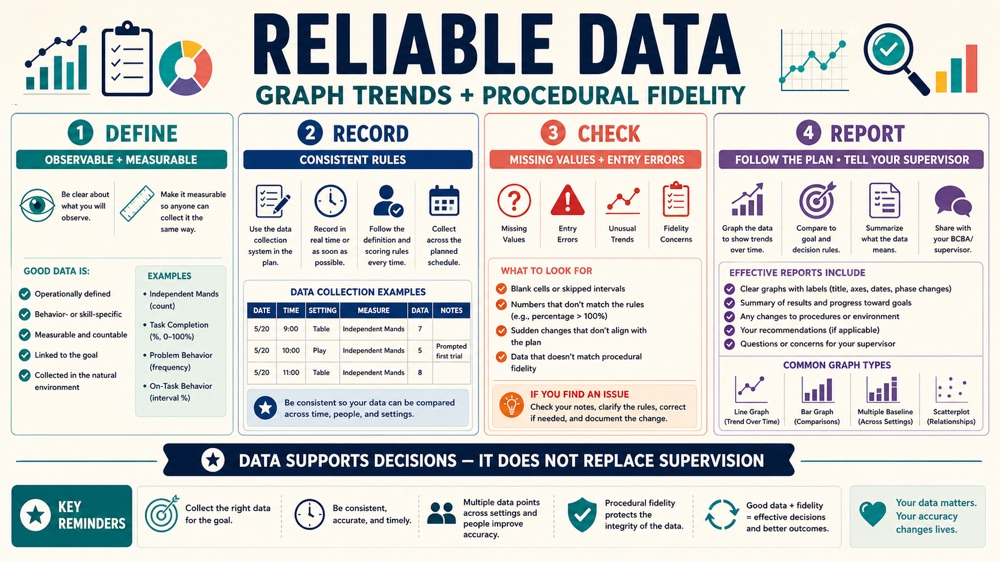
Reliable data is not merely data entered into an app. It is data collected with a consistent definition and procedure, recorded at the right time, transferred without error, and checked against the plan. The current TCO specifically asks candidates to describe risks associated with unreliable data collection and poor procedural fidelity.
- Definition drift: observers gradually change what counts as the behavior.
- Recording omission: an RBT stops recording during a difficult moment and later fills in a guess.
- Data-entry error: a value is transposed, entered under the wrong date, or placed in the wrong phase.
- Opportunity changes: the number or type of teaching opportunities changes, but the raw count is compared as if exposure were identical.
- Procedure drift: prompts, reinforcement, timing, or consequence steps differ from the written plan.
- Technology failure: a device, timer, or app stops recording and the gap is hidden rather than reported.
Unreliable data can create a false trend, hide a lack of progress, make a successful plan look ineffective, or lead the team to overlook a safety concern. Procedural fidelity is equally important: a low outcome may reflect inconsistent implementation rather than the learner’s skill or the intervention itself.
From session record to graph trend
Entering data and updating graphs are separate from collecting the original observation, but the links must remain accurate. Before entering a value, check the client or program, date, target, unit, phase, and any required opportunity or duration field. A correct value entered on the wrong graph is still misleading.
A graph trend describes the direction or pattern of data across time. A single high or low value is not automatically a trend. Look at level, direction, variability, phase changes, and relevant context as defined by the team. An RBT can identify and communicate an apparent pattern; the supervising clinician determines whether the plan should change.
| Observation | Careful statement | Overreach to avoid |
|---|---|---|
| Values fall after a plan change. | “The recorded values decreased after the phase change; please review the graph.” | “The intervention cured the behavior.” |
| Values vary across staff. | “The values are more variable when different observers collect data; fidelity may need review.” | “That staff member caused the behavior.” |
| A session has missing data. | “The device failed from 2:10 to 2:20; the value is missing.” | Inventing a number to make the graph complete. |
Objective communication protects the learner and the team. The purpose of data is not to make a graph look smooth; it is to preserve what was actually observed and make uncertainty visible.
The RBT role: collect, check, communicate, and follow the plan
RBTs commonly collect data, enter data, update graphs, implement written procedures, and report relevant variables under supervision. They do not independently choose a new measurement system, rewrite an operational definition, change reinforcement criteria, or interpret a trend as permission to modify treatment without clinical direction.
- Before the session: read the target definition, measurement rule, opportunity rule, and recording tool.
- During the session: record what the plan defines, including prompts or independence when required.
- After the session: check entries for date, unit, target, and missing values; update the approved graph.
- When something is wrong: document the limitation and tell the supervisor promptly.
- When the plan is unclear: pause the uncertain decision and seek clinical direction; do not create a new procedure alone.
Exam clue: when a question gives a written plan and a tempting “better” measurement idea, the best RBT answer is usually to follow the plan and communicate the concern. Precision includes staying within role.
Why data collection is an important part of ABA: a Domain A study checklist
| Current task | Can you explain or do it? |
|---|---|
| A.1 Continuous measurement | Choose and apply frequency, duration, latency, or IRT when the plan calls for it. |
| A.2 Discontinuous measurement | Distinguish partial interval, whole interval, and momentary time sampling. |
| A.3 Permanent product | Identify when a lasting product represents the target and what it cannot prove. |
| A.4 Data and graphs | Enter values and update the correct graph without changing the source record. |
| A.5 Observable terms | Replace vague labels with behavior that another observer can record. |
| A.6 Calculations | Calculate or summarize rate, mean duration, percentage, and related values when required. |
| A.7 Trends | Describe direction, level, variability, and phase context without overclaiming. |
| A.8 Risks | Recognize unreliable data and poor procedural fidelity, then report the concern. |
Bottom line: data collection is an important part of ABA because it creates an objective, reviewable connection between what happened in a session and what the supervising team decides to do next. For the RBT exam and for supervised practice, learn the measurement rule, apply it consistently, protect the integrity of the record, and ask for direction when the definition, tool, or plan does not fit.
Practice the measurement decision, not just the definition.
Review current Domain A concepts with original scenarios and explanations that show why the nearest answer is not always the best one.
Review RBT study materials →
Frequently Asked Questions
Why is data collection an important part of ABA?
Accurate data gives the supervising team a consistent record of observable behavior or skill performance. It supports comparison across sessions, graph review, treatment evaluation, and identification of unreliable procedures.
What data does an RBT collect?
An RBT collects the data specified by the written program, which may include frequency, rate, duration, latency, interresponse time, interval recording, permanent product, trial responses, or other approved measures.
What happens if the data sheet or app is wrong?
Record the limitation according to workplace procedure, preserve the original information, and contact the supervisor. Do not guess missing values or independently redesign the measurement system.
Is frequency the same as rate?
No. Frequency is the count of responses; rate places that count in relation to time. Six responses in five minutes and six responses in thirty minutes have the same frequency but different rates.
What is procedural fidelity?
Procedural fidelity is the degree to which a written procedure is implemented as designed. Poor fidelity can make outcome data difficult to interpret because the recorded result may reflect inconsistent implementation.
Is this an official BACB data-collection lesson?
No. This is independent educational content aligned to the published RBT Test Content Outline (3rd ed.). The examples are newly written and are not official, recalled, leaked, or BACB-endorsed questions.
References
- Behavior Analyst Certification Board. RBT examination resources.
- Behavior Analyst Certification Board. RBT Handbook.
- Behavior Analyst Certification Board. RBT Test Content Outline (3rd ed.).
- Certified RBT Domain A study guide. Reviewed for competitor research; not an official BACB source.
- My RBT Prep data collection guide. Reviewed for competitor research.
- ATCC data collection explainer. Reviewed for competitor research.
- ABA Notes Pro ABC data guide. Reviewed for competitor research.