

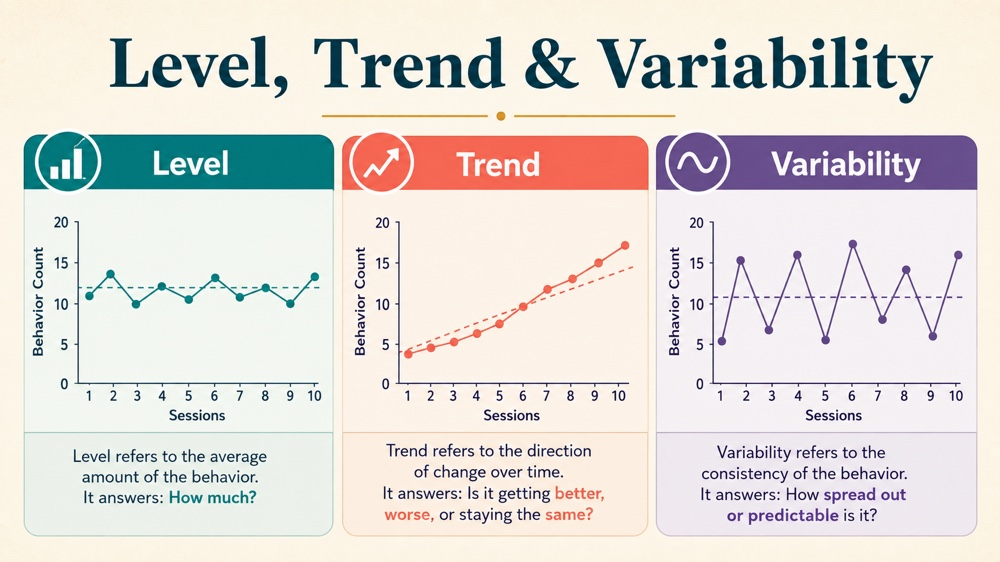
Level, trend, and variability ABA are three graph features that help a learner describe data before jumping to a conclusion. The exact phrase level trend and variability aba names the study topic used on this page. Level refers to the typical amount or position of data in a condition, trend describes the direction or pattern of change, and variability describes how widely the points fluctuate. For an RBT, the study focus is accurate data collection, clear communication, and careful description of what the graph shows. A technician does not independently diagnose a function, declare treatment success, or redesign a program from one visual impression. This guide uses simple language and original examples so learners can practice separating observation from interpretation. The current written program and supervisor remain the source for measurement definitions, graphing procedures, and clinical decisions. Good graph reading starts with data integrity and ends with a properly bounded report.
Table of Contents
- Level trend and variability ABA: the three features
- Describe level without overclaiming
- Describe trend with direction and context
- Describe variability as spread
- Protect data quality before reading the graph
- Separate visual description from interpretation
- Use an RBT graph-reading routine
- Avoid graph-feature mistakes
- Level trend and variability ABA checklist
- Frequently Asked Questions
- References
Continue your RBT study with RBT exam study materials and original practice resources.
Quick answer: Treat level trend and variability aba as a current-source RBT study topic. Define the concept, connect it to observable action, use original examples, and keep the supervision boundary visible.
Study boundary: This independent guide is educational content. It is not a BACB policy, certification decision, legal opinion, answer key, or guarantee of examination success. Examples are original and are not official, recalled, leaked, or BACB-endorsed questions.
Current exam context: The current BACB RBT Test Content Outline describes 43 tasks across six domains; the examination includes 75 scored questions and 10 unscored pilot questions in a 90-minute testing period. Verify the current handbook and outline before relying on a time-sensitive detail.
Level trend and variability ABA: the three features
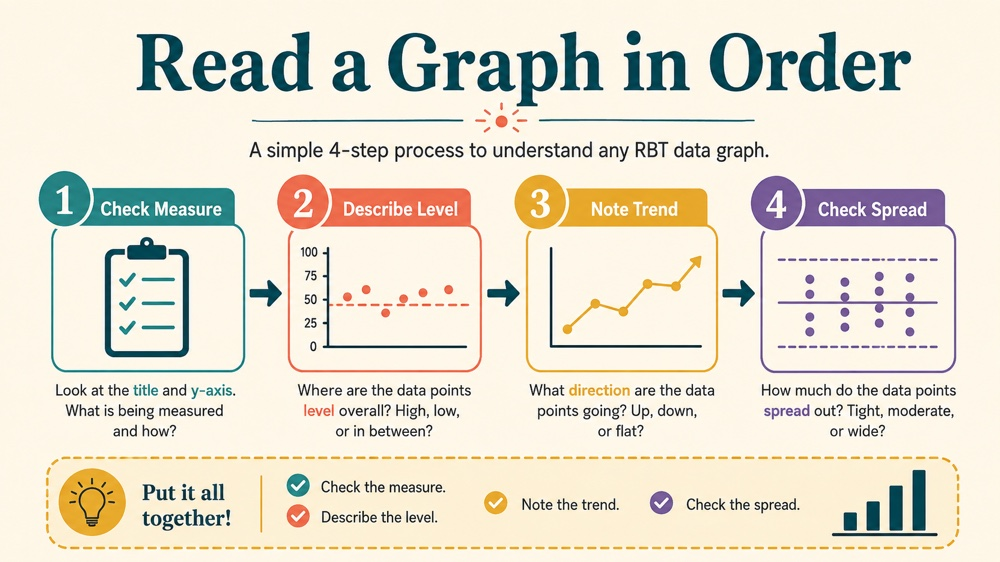
Read the graph in a consistent order. First ask where the points generally sit, then whether they move upward, downward, or remain stable, and finally how much they spread around that pattern. The terms describe features of displayed data; they do not by themselves explain why behavior changed.
Describe level without overclaiming
Level can be discussed as a typical or central position within a condition. Choose the language used by the course or supervisor and avoid pretending that a rough visual estimate is an exact calculation. Compare comparable phases and note missing data or unusual sessions before summarizing.
Describe trend with direction and context
Trend is a direction or systematic pattern across points. State whether the pattern appears increasing, decreasing, flat, or unclear, and identify the phase or time window. A short run of points may not justify a broad claim. The technician reports the displayed pattern and the relevant context.
Describe variability as spread
Variability concerns how much the points move around the general level or trend. High spread can make a direction harder to interpret; low spread can make a small change easier to notice. Check the measurement system, opportunity count, setting, and unusual events before treating variability as a learner characteristic.
Protect data quality before reading the graph
Use the assigned operational definition, measure, timing, and recording rule. Missing sessions, changing observers, inconsistent opportunities, or a new procedure can affect the display. If the data appear surprising, report the observation and possible context rather than changing entries to create a cleaner line.
Separate visual description from interpretation
A graph may show lower frequency during one phase, but the technician should not claim causation or function without the appropriate analysis. Practice two sentences: one objective description and one question for the supervisor. This makes the role boundary visible and keeps communication useful.
Use an RBT graph-reading routine
Name the graph and measure, identify the phase, describe level, trend, and variability, check data quality, record relevant setting events, and communicate the question. Use original data displays with no client identifiers. If the supervisor asks for a summary, use the agreed format and avoid unsupported labels.
Avoid graph-feature mistakes
- Calling any upward movement a meaningful trend.
- Treating visual level as a clinical conclusion.
- Ignoring variability or missing data.
- Comparing incompatible measures or phases.
- Changing the graph or data to make a point look better.
- Confusing an observation with a functional interpretation.
- Presenting a study graph as official examination content.
Level trend and variability ABA checklist
- Can I define level, trend, and variability?
- Can I describe each feature without claiming causation?
- Did I check the measure and operational definition?
- Did I note phase, setting, and missing data?
- Can I separate description from interpretation?
- Do I know who reviews an unexpected pattern?
- Are my examples original and privacy-safe?
Use level trend and variability ABA as a graph-reading practice topic. RBT Training is independent educational content and is not affiliated with or endorsed by BACB.
Practice the concept
Review level trend and variability aba with original RBT scenarios, current-source reminders, and clear role boundaries.
Review the RBT study resource →
Frequently Asked Questions
What are level, trend, and variability in ABA?
They are graph features: the typical position of data, the direction or pattern of change, and the amount of spread among points.
Can an RBT interpret a graph independently?
An RBT can collect and describe assigned data, but clinical interpretation and program changes require the appropriate supervisor or professional.
Why does variability matter?
Large fluctuations can make a direction harder to describe and may prompt a check of measurement, context, or implementation consistency.
Are these official BACB questions?
No. They are original educational scenarios and are not official, recalled, leaked, or BACB-endorsed.
References
- Behavior Analyst Certification Board: Registered Behavior Technician Handbook, updated June 2026.
- Behavior Analyst Certification Board: RBT Test Content Outline (3rd ed.).
- Behavior Analyst Certification Board: RBT resources.
- Behavior Analyst Certification Board: ethics resources.
- Behavior Analyst Certification Board: RBT Ethics Code (2.0).